As an Amazon Associate, we earn from qualifying purchases. Some links on this site are affiliate links at no extra cost to you. Our recommendations are based on thorough research and editorial judgment.

How Much Does It Cost to Install Solar Panels on a House in 2026?
I’m seeing that a typical 2026 residential solar install runs about $21,800 for a 7.2 kW system, which translates to roughly $3.03 per watt, while the $0.30–$0.50/W breakdown includes modules, inverter, labor, mounting hardware, and permitting; the 30 % federal tax credit trims the out‑of‑pocket cost to about $15,300, and a 10‑year loan at 3.5 % APR yields monthly payments near $225, producing an annual energy output of roughly 9,500 kWh and a payback period close to 12 years, and if you keep going you’ll discover more details.
Key Takeaways
- National average 7.2 kW residential system costs about $21,800 (~$3.03/W) before incentives, ranging $25k–$50k total.
- Federal Investment Tax Credit (30%) reduces a $21,800 system to roughly $15,300, cutting outlay by $6,500.
- Per‑watt cost breakdown: modules $0.30/W, inverters $0.34/W, labor $0.22/W, mounting $0.15‑$0.20/W, permitting $0.30‑$0.50/W.
- Typical annual energy production for a 7.2 kW array is ~9,500 kWh, saving about $1,200 /yr at $0.13/kWh, yielding a ~12‑year payback after tax credit.
- Financing options (e.g., 10‑year loan at 3.5% APR) add $225 / mo, while lease plans require $0 upfront but for for the federal credit.
Average 2026 Home Solar Installation Cost?
The average 2026 residential solar installation costs between $25,000 and $50,000 before incentives, with a typical 7.2 kW system priced at $21,816, which translates to approximately $3.03 per watt, while the national average installation expense sits at $19,873, ranging from $12,600 to $33,376. I note that the cost per watt varies from $2.50 to $3.50 depending on equipment, labor, and permitting, and that a 7.2 kW array includes panels, inverter, mounting hardware, and wiring, each contributing specific unit costs; additionally, energy storage options such as lithium‑ion batteries add $0.70–$1.20 per watt, influencing total outlay. I also consider maintenance plans, which typically charge $0.10–$0.15 per watt annually for monitoring, cleaning, and warranty services, thereby affecting long‑term financial projections.
What Components Drive the $2.50‑$3.50 Per‑Watt Cost?

Solar panel costs break down into several distinct components, each contributing a specific portion of the $2.50‑$3.50 per‑watt price. I allocate roughly $0.30/W for the photovoltaic modules, $0.34/W for inverters, $0.22/W for labor, and $0.15‑$0.20/W for mounting hardware, while the remaining $0.30‑$0.50/W covers permitting, interconnection fees, and utility‑grid upgrades, which together reflect the impact of panel degradation assumptions, maintenance plans, warranty terms, and company reputation on overall pricing. I consider degradation rates of 0.5‑1 % annually, which influence long‑term output guarantees, and I evaluate warranty terms ranging from 10‑ to 25‑year coverage, as they affect risk assessments and insurance premiums. I also compare maintenance plans that cost $0.05‑$0.10/W annually, noting that reputable installers often bundle extended service contracts, thereby modestly increasing the per‑watt figure yet providing predictable performance throughout the system’s lifespan.
Recommended Products

【More Daily Output】 Starting from Nov 3, 2025, due to tech iteration, the tracking system is fully equipped with 195W N-type panels, taking the quality-to-price ratio to a new level.This 1200W solar tracking kit's ideal daily output power is about 7.68KWh per day under 4 hours full sunlight. Suitable for home, farm, shed, cabin. It is strong enough to power all your home appliance.

Premium Aluminum Rails: 12 QTY 7.3-foot Rails (88 Inches or 2250mm length) and 20 QTY Rail Splicers for 10 splicing points. Rails are made in the USA with 90% recycled aluminum

Premium USA-Made Rails: 12 QTY 7.3-foot Rails (88 Inches or 2250mm length) and 20 QTY Rail Splicers for 10 splicing points. Rails are made in the USA with 90% recycled aluminum
How Does System Size Affect Solar Installation Cost?

Cost per watt scales with system size because larger arrays spread fixed expenses—permits, interconnection fees, and grid upgrades—over more kilowatts, while variable components such as modules, inverters, and mounting hardware retain roughly linear pricing. I explain that a 5 kW system typically costs $2.84 /WW, totaling about $14,200 before incentives, whereas a 12 kW array averages $2.55 /W, reaching roughly $30,600, and the per‑watt reduction arises from economies of scale, especially when panel spacing is optimized to maximize roof coverage without compromising energy output. I note that larger systems require proportionally more mounting hardware, yet the incremental cost per watt declines because labor and permitting fees are amortized, resulting in a lower overall cost per kilowatt‑hour generated.
Recommended Products

[Generate more power] Dual-axis solar tracker make the mounted panels turn face to sunlight any daytime. Compared to fixed solar panels, the PV power generation can increase at least 40% with the tracker
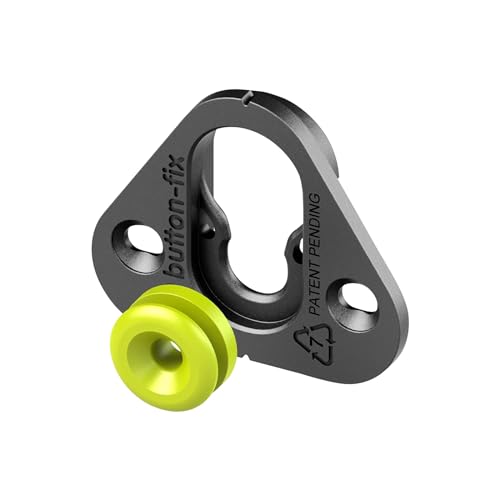
EASY TO INSTALL: Fixing panels is quick and easy without the need for screws or bolts

[ Strong Adaptability ] ECO-WORTHY Mounting Bracket is 236"Lx39"W In. the front and rear pillars are 5.9 in higher, the front column is 13.78 in, and the rear column is 28.53 in,Which can better support 5*400W large Solar Panels.Suitable for home, farms, cabin and off-grid
How Does the 30 % Federal Tax Credit Change Cost?
A 30 % federal tax credit, which applies to the full installed price of a residential solar system, reduces a quoted $21,816 cost for a 7.2 kW array to $15,271, thereby lowering the effective per‑watt price from $3.03 to $2.12. I calculate that this credit eligibility means homeowners pay $6,545 less than the pre‑credit total, a reduction that scales linearly with system size, so a 5 kW installation drops from $14,210 to $9,937, while a 10 kW system falls from $33,240 to $23,268. The federal phaseout scheduled for 2026 will eliminate the credit, restoring original prices and raising per‑watt costs back toward $3.00. Consequently, the credit’s impact on net cost, cash flow, and return‑on‑investment metrics must be modeled precisely, incorporating equipment, labor, permitting, and inverter expenses, to guarantee accurate financial projections before the phaseout takes effect.
Recommended Products

Reliable LiFePO4 Technology: Our 16-cell LiFePO4 battery boasts an impressive lifespan of 2500 to 7000 cycles over 10 years. Equipped with an advanced Battery Management System (BMS), it's safeguarded against overcharging, deep discharges, overloads, overheating, short circuits, low temperature cut-off, and boasts an exceptionally low self-discharge rate.

System Components:Delivers up to 10kW power output with 120V/240V single-phase split-phase support, making it suitable for smoothly running common household appliances. The system includes 18 × 590W solar panels with a total PV capacity of 10620W, capable of generating up to 39.36 kWh per day under optimal conditions, along with two 48V 314Ah portable LiFePO₄ battery offering 32.2 kWh of energy storage. Complete with necessary cables, this all-in-one solar solution is designed for convenient setup and reliable home power support.
[Bifacial Technology] Designed to capture sunlight from both sides, this panel increases energy yield by up to 30%, making it ideal for various installations, including rooftops and ground mounts.
How Do Roof Type, Home Size, and Location Affect Cost?
When evaluating a solar installation, I consider roof material, square footage, and regional climate, because each factor directly influences engineering design, mounting hardware selection, and total system cost, which can vary from $2.84 to $3.50 per watt depending on structural constraints and local labor rates. A steep roof pitch may require custom rails, increasing material cost by 5‑10 %, while an older roof material often necessitates reinforcement, adding $0.20‑$0.30 per watt. Shading impact, measured in percent of panel obstruction, reduces orientation efficiency and can raise system size by 10‑15 % to meet energy goals, thereby inflating overall expense. Larger homes, typically above 2,000 sq ft, demand higher kilowatt capacity, raising per‑watt cost modestly due to economies of scale, whereas high‑insolation locations lower required capacity, improving cost‑per‑watt efficiency.
Recommended Products

GALVANIZED STEEL DOUBLE ROOF: This patio gazebo has a double-layer galvanized steel roof that offers great ventilation and airflow. Its sturdy construction provides protection against wind, rain, and snow, while the galvanized steel material ensures thermal insulation, waterproofing, and noise reduction.
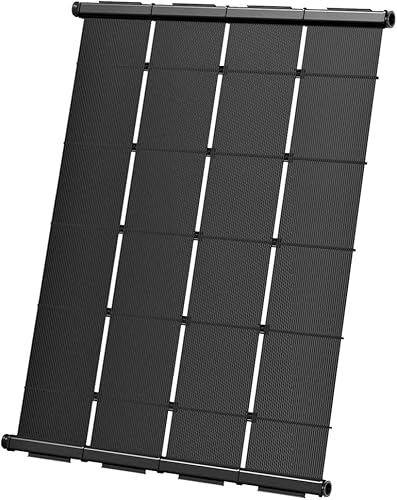
TOP OF THE LINE - A technologically advanced design makes SwimJoy one of the most durable, efficient, & maintenance-free solar pool heater panels available! SwimJoy’s specialized square header maximizes flow and increases efficiency.

Handcrafted in the USA; 25-year output warranty; Easy installation; Best-in-class solar cells
How Do Financing Options Alter Out‑of‑Pocket Cost?
Roof material and square footage set the baseline engineering constraints, so the next logical factor is financing, which reshapes the out‑of‑pocket expense by converting the upfront capital into periodic payments, thereby altering cash flow while preserving the same installed capacity and per‑watt cost. I evaluate loan amortization, noting that a 7.2 kW system priced at $21,816 before incentives can be financed at 3.5 % APR over 10 years, resulting in monthly payments near $225, which totals $27,000, increasing the effective cost by roughly $5,200 compared with cash purchase. Lease terms, often 20‑year agreements with $0 upfront, shift ownership to the provider, allowing me to pay $0‑$30 per month, but they typically exclude the 30 % federal tax credit, so my credit score determines eligibility and interest rates, affecting the net present value of the arrangement.
Recommended Products

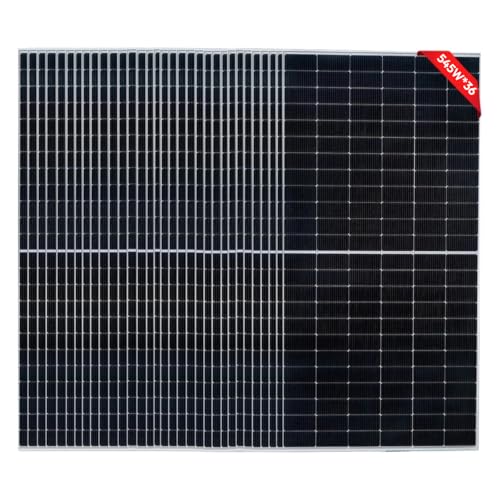
★【Lower Your Electric Bills】 : The SUNGOLDPOWER 590W bifacial solar panel uses advanced N-Type 16BB cells with up to 22.8% high efficiency, generating more power per square foot and helping you take control of rising electricity bills.

Safe & Powerful: Renogy 320 watt Solar Panels performs 20 watts higher than regular 300 watt solar panels, total power adds up over 600 watts, daily 3200Wh of electricity and generates electricity with no microcracks to pretect your battery, EL certified.

1. UL61730 Certified & 30-Year Long Lifespan ETL certified to meet North American safety standards, ensuring compliance with Amazon US/CA platform requirements and eliminating listing removal risks. Adopting high-quality double glass encapsulation and premium materials, this 430W solar panel boasts a 30-year service life, with stable power output and low light-induced degradation (LID) over time, far exceeding the industry average lifespan. It can withstand extreme wind pressure (up to 2400Pa) and snow pressure (5400Pa), making it suitable for long-term outdoor use in various harsh environments.
What Is the Break‑Even Period and 25‑Year Savings?
Because the installed capacity determines both the upfront cost and the annual energy production, the break‑even period can be calculated by dividing the net out‑of‑pocket expense—after applying the 30 % federal tax credit and any state rebates—by the yearly electricity savings derived from the system’s kWh output, which for a typical 7.2 kW residential array in 2026 averages 9,500 kWh at a utility rate of $0.13 /kWh, yielding roughly $1,235 in annual savings. Using that figure, the payback timeline for a $15,271 net cost is about 12.4 years, after which the system generates net positive cash flow. Over a 25‑year horizon, cumulative savings reach approximately $30,875, representing a long term ROI of roughly 103 % relative to the initial outlay, assuming stable electricity rates and no major system degradation.
How to Compare Solar Installation Cost Quotes in 2026?
The break‑even analysis shows a 7.2 kW system costing $15,271 after the 30 % tax credit yields roughly $1,235 in annual savings, so the payback period is about 12.4 years. I begin each quote review by listing total price, per‑watt cost, and equipment breakdown, then I construct a bid comparison matrix that aligns panel efficiency, inverter rating, and mounting hardware across all proposals, allowing me to isolate cost drivers without mixing labor and permitting fees. I also verify installer warranties, checking that product guarantees cover at least 10 years while labor guarantees extend 5 years, and I confirm that performance guarantees include a minimum 0.5 % annual degradation rate. Finally, I cross‑check financing terms, tax‑credit eligibility, and any local rebate amounts to make certain the net cost matches my calculated payback.
Frequently Asked Questions
Do Solar Panels Increase Home Resale Value?
I’ve seen solar panels boost resale value because buyers love energy savings and the added market appeal, especially when the system’s already installed and the tax credit’s still in place.
Can I Install Solar on a Flat Roof Without Extra Cost?
I’ve seen installers say a 5 kW flat‑roof system can cost the same as a sloped roof when you add ballasted mounts, but you’ll still need roof reinforcement to handle the extra weight.
What Maintenance Expenses Should I Expect After Installation?
I’d expect about $150‑$300 yearly for annual cleaning and occasional inverter replacement, which usually costs $1,000‑$2,000 every 10‑15 years, plus minor inspection fees.
Are There State or Local Incentives Beyond the Federal Tax Credit?
Ever wonder if you can boost savings? I’ve found state rebates and utility programs often supplement the federal credit, offering cash incentives, performance‑based rebates, and reduced‑rate tariffs that can shave thousands off your total cost.
How Does Shading From Trees Affect System Performance and Cost?
I’ve seen tree shading cut a system’s output by up to 30%, so I’d recommend panel microinverters to isolate each panel’s performance and avoid costly overall‑system losses.